Internals
The ctrl_orca package is the engine for orchestration. It uses plug-ins to customize how specific workflows are setup and launched. This is a brief description of how Orca does what it does.
Production
The production starts by configuring the production, by using a
ProductionRunConfigurator. This is a customizable component and can be
overridden at the start, but in practice the generic
ProductionRunConfigurator has served our needs up to this point. The
ProductionRunConfigurator initializes the location of the messaging broker,
the production shutdown even topic, the log level threshold, and default values
of the production configuration. When configured, the object creates all
associated DatabaseConfigurators, and any pipeline loggers (via
LoggerManagers) associated with them. In practice, this has been one
database, and one logger. If there is additional configuration information
that needs to be set at this point, a production Config can specify an object
to be created and that special configuration can be set. (This is instead of
creating an entire ProductionRunConfigurator, only to do one additional
configuration). Note that the DatabaseConfigurator is the generic term
for this object; specialized versions of this object can be created. The
single Configurator used to this point is one that connects to MySQL.
Note
The following information about WorkflowManagers,
WorkflowConfigurators, and WorkflowLaunchers, describe the generic
tasks done by each object. Specifics of each depend on their plug-in
implementation, and are discussed in the next section.
Each Config for each Workflow instance is examined, and the appropriate
WorkflowManager is created, according to which plug-in was specified. The
WorkflowManager is created and initialized with the Production Config and a
Workflow Config. Once it has been initialized, the WorkflowManager is
configured.
After all WorkflowManagers are created, they are all returned to the
ProductionRunConfigurator. The ProductionRunConfigurator keeps track
of all the WorkflowManagers, and all their associated LoggerManagers
which have been created.
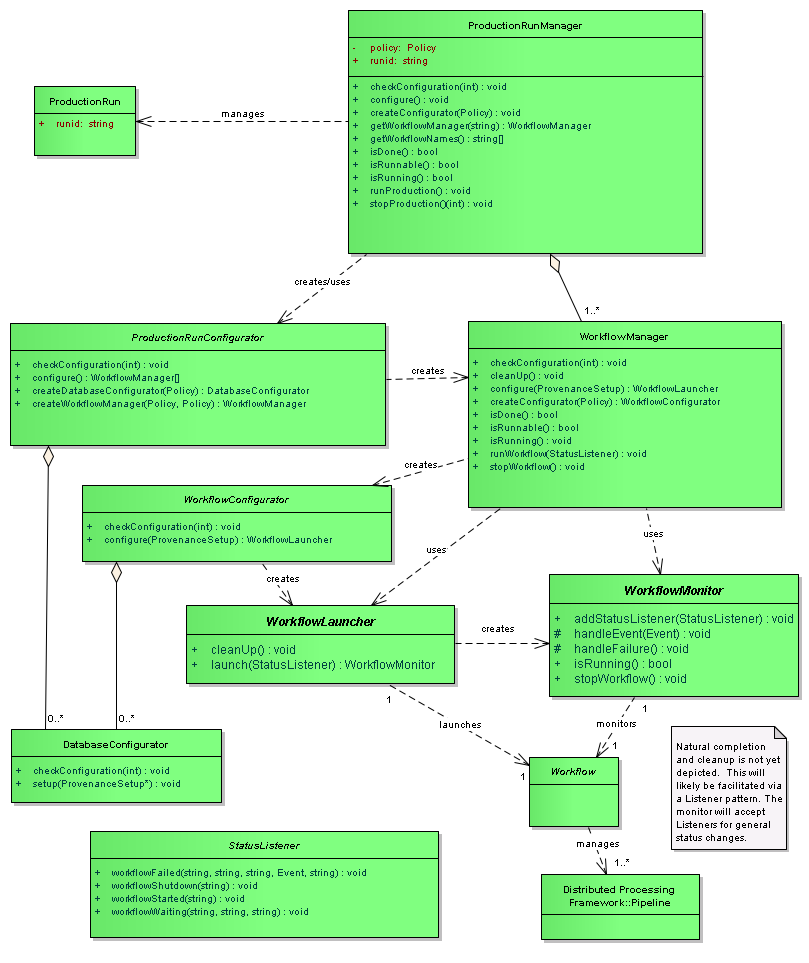
The ProductionRunManager now tells each WorkflowManager to initiate
their Workflow, associating a StatusListener to each of them.
When the WorkflowManager initiates a Workflow, several things happen.
First, it creates the WorkflowConfigurator which is associated with this
WorkflowManager, and it configures the workflow, and returns a
WorkflowLauncher to the WorkflowManager. The WorkflowManager uses
the Launcher to start the workflow. After the Launcher starts, it returns a
WorkflowMonitor.
The ProductionRunManager now waits for either an out of band message or for
all of the Workflows to end. The out of band message can be sent from one
of the ctrl_orca utilities (shutprod.py or
shutwork.py). Messages have various priorities from “clean up after
you’re done with the current set of jobs” to “stop immediately”. When either
the out-of-band message is sent to kill current work, or if the production runs
to completion, any clean up that needs to occur happens, and the entire
Production is complete.
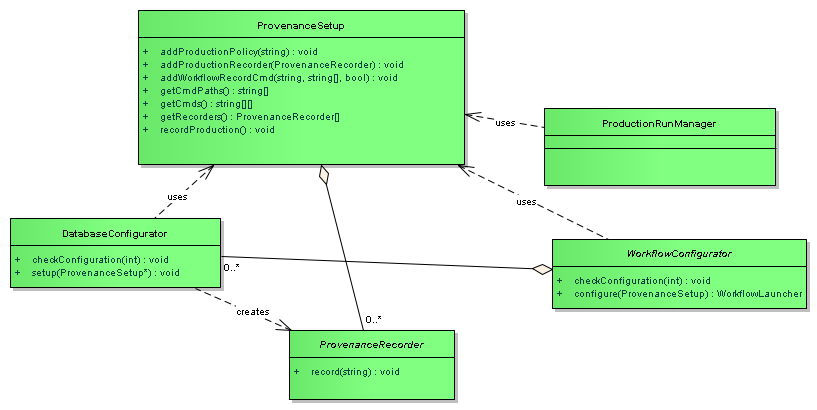
Provenance
The ctrl_orca package did at one time record initial provenance of the production, software stack and workflows, but currently does not. The ctrl_provenance package, while maintained, was set to be replaced quite some time ago. It operates on paf files (Policy files), which were the original format of the production run descriptions. At the time of the announced transition away from Policy for production runs, the ctrl_orca package was changed to use Config files, which it uses now. A new version of ctrl_provenance is being worked on; when that work is complete, ctrl_orca will re-add provenance recording to orchestration.
Workflows
Customization of how workflows are configured, launched and monitored are
handled through a set of plug-ins for the particular type of workflow being
launched. Generally, one plug-in consists of three different modules that need
to be created: A WorkflowConfigurator, a WorkflowLauncher, and a
WorkflowMonitor.
Several different type of plug-ins have been created, and several of those still exist:
GenericPipeline- launches jobs directly on the running system;VanillaCondor- launches single HTCondor jobs to a queue using the “vanilla universe” HTCondor setting; andCondor- launches DAGman jobs to an HTCondor queue. We currently only use theCondorplug-in, and its functionality will be described below.
Logging
Logger processes are spawned by a LoggerManager. In the current version of
Orchestration, the system can be configured so that the pipeline logging
messages can be stored in several different ways, and in several different ways
at the same time. For example, the logging messages can be stored to disk, and
sent to an event topic using the ctrl_events package at the same time. In
the data challenges, we used event topics to send all logging messages to a
database table for future analysis. We were able to use this to provide timings
about how various parts of the pipeline ran, and to debug issues that came up.
CondorWorkflowConfigurator
- Creates a local staging directory (and subdirectories) for HTCondor job information to be stored
- Writes the pre job script (the script that runs before any workers are run),
- Writes the post job script (the script that runs after all workers have completed)
- Writes an optional pre-script (a script that runs before each worker runs)
- Writes the worker job script.
- Writes an HTCondor DAG,
By default, the HTCondor DAG file is set up as a diamond shape: one pre-job script, all of the work job scripts as children of the pre-job script, and one post-job script, which is the child of all work job scripts. This script is part of the Config file, and can be substituted to create other types of DAGs.
The pre job script creates all necessary directories in shared scratch space which the workers will later write to. It also dumps a listing of all the software stack environment to the file system. Note that this script runs on the remote compute site.
The worker job script takes as arguments, the run id (assigned by the user on launch), the worker id (assigned by orchestration), and a series of flags intended for the pipeline process. The script creates its own subdirectory in the workflow work space, and parses the arguments to hand to the pipeline to be executed. Standard output and standard error for the process are logged.
The post job script does nothing.
We currently do not use pre-scripts.
Note that these scripts are site specific, and are written by the templating system. Site specific scripts and the templating system are explained on this page.
The final step is to create and initialize a CondorWorkflowLauncher. This
is handed back to the WorkflowManager.
CondorWorkflowLauncher
On launch, the CondorWorkflowLauncher does the following:
- Submits the DAG file using the HTCondor
condor_submit_dagcommand - Creates and initializes a
CondorWorkflowMonitor - Optionally adds a
StatusListener - Starts a Workflow Monitor Thread
- Returns the
CondorWorkflowMonitorto theWorkflowManager.
CondorWorkflowMonitor
The CondorWorkflowMonitor spawns a thread that keeps track of whether the
HTCondor DAG it submitted has completed, or whether it has received a message
from an outside source to perform a shutdown. It also waits for a message from
the Logger to indicate that all messages from the production have been received,
which indicates that the production has been completed.
General Notes
The implementations described are in the current version of orchestration. These are not necessarily implementations of what orchestration will act like in production. Keep in mind, the plug-ins used can be extended to add additional functionality.
We made the following assumptions:
- Workers on compute nodes all write to a common shared scratch space.
- The software execution stack used on the launch node is the same version as the stack available on the worker nodes. In fact, the packages set up on the launch node are the same packages that will be set up on the remote nodes. If a package is not set up, or does not exist on the launch node, it will not be configured on the remote nodes.
- Orchestration does not stage input files. Input data files are assumed to be accessible by all compute nodes before a workflow is started.
- Orchestration does not retrieve output files. Output files are kept in scratch space in a well-known directory, and are not transferred after a workflow is complete.
- Logging is captured from pipelines via the messages sent through the
ctrl_events package to a
Loggerspawned by orchestration. - No authentication with HTCondor is performed.
- Authentication with the database is configured using the
$HOME/.lsst/db-auth.paffile that’s used by the LSST database access package.
Notes on Logging
The logging system has been ported to use the required lsst.log package, which
all the LSST software uses. The ctrl_events package has an
EventAppender, so that logging messages can be sent to ActiveMQ topics.
This was done for a couple of reasons.
First, there was a desire to ingest all logging messages into a database. We were able to use this to easily compute timing information about how long pipelines were taking, along with a variety of other measurements.
Second, since messages were all sent out on Topics, we could monitor the status of the workflows using programs that just watched the message traffic, without having to modify any pipeline code. We had a couple of ways of monitoring running pipelines.
One was by using a program that captured logging traffic, and printed it out to the screen.
We also implemented a complex event processing system (Event Monitor in package ctrl_evmon), which we used to watch for certain conditions to occur during processing, and then send notifications when a condition was satisfied. For example, if a pipeline was supposed to take a certain amount of time, the Event Monitor would watch for starting and ending events, and send an error message when the time spent processing was exceeded. We also used this tool after processing was completed, by pointing to the logging database as an input source. This gave the same results as running live, but allowed us to detect issues if the Event Monitor hadn’t been running while the pipelines were.
While all messages were successfully captured during testing and data challenges, we did uncover a problem. We ran into an issue where events were sometimes being emitted at a rate that prevented us from adding them into the database table for the run in a timely manner. Analysis of this problem showed that the bottleneck was the method being used to insert the information into the database, not the broker itself as initially suspected. No events were lost, but it wasn’t as fast as we wanted. A permanent solution to this issue was not pursued.
One solution to this is to bypass the event message logging mechanism completely, and log messages locally to the compute node. Recovery of those logs would be done as part of the cleanup process after computation is completed, either transferring them directly or by using a third-party utility such as logstash.