Coverage Analysis
Verifying Test Quality
The purpose of coverage analysis is to verify the thoroughness of a test suite. For example, unit tests are used to validate the implementation of detailed design objects through comprehensive testing. Coverage analysis checks that the testing is, indeed, comprehensive by executing instrumented unit tests which records the complete execution path through the code and then calculating metrics indicative of the coverage achieved during execution.
Coverage analysis examines the output of a code instrumented to record every line executed, every conditional branch taken, and every block executed. It then generates metrics on:
Percent of statements executed
Percent of methods (and/or functions) executed
Percent of conditional branches executed
Percent of a method’s (and/or function’s) entry/exit branches taken.
The metrics give a general idea of the thoroughness of the unit tests. The most valuable aspect of most web-based coverage analysis tools is the color-coded report where the statements not exercised and the branches not taken are vividly evident. The color-coded coverage holes clearly show the developer where unit tests need improvement.
Using the coverage analysis reports, the LSST DM developer should determine code segments which have not been adequately tested and should then revise the unit test suite as appropriate. Coverage analysis reports should be generated in concert with the routine automated CI testing.
A line having test coverage does not mean that any test actually checks that the line does the correct thing, only that that line was run by python when executing the tests. Coverage is a minimal check (“did we even run this line?”), not a functionality check (“did this line do what it was supposed to do?”).
Using Coverage Analysis Tools
Python
The LSST DM pytest suite runs pytest-cov to run Coverage.py when running tests via scons, producing a coverage report in the tests/.test/pytest-PACKAGE.xml-htmlcov directory.
The exact path is printed at the end of the pytest section of the scons output.
Open the index.html file contained therein (for example, on a mac run open tests/.test/pytest-PACKAGE.xml-htmlcov/index.html to load it in your default browser) for a listing of the coverage percent for each file.
Click on a filename in the list to get a line-by-line listing of what was and wasn’t run.
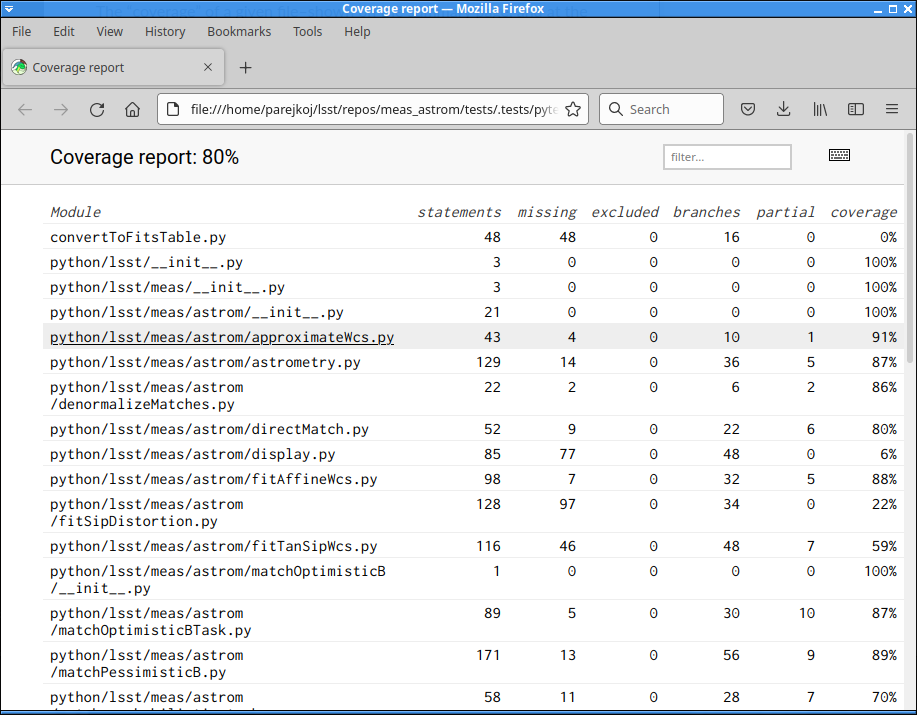
Coverage HTML summary page. This is the index.html page produced from running scons on the meas_astrom package. Click on a file to get a summary of that file.
The “coverage” of a given file–shown on the summary page, and at the top of the individual file page–is the total lines of code excluding docstrings/comments/blank lines divided by the number of lines run.
Red lines were not run by the tests you ran, yellow are “partially run” (e.g. an if-statement condition that is only satisfied in one way).
Imports, class and function declarations, and Configs are some examples of lines of code that get executed when a file is imported.
Those can artificially inflate coverage statistics: a file with only 1-2 lines per function that is included in __init__.py might have >50% coverage, even though no tests actually run any of the functions!
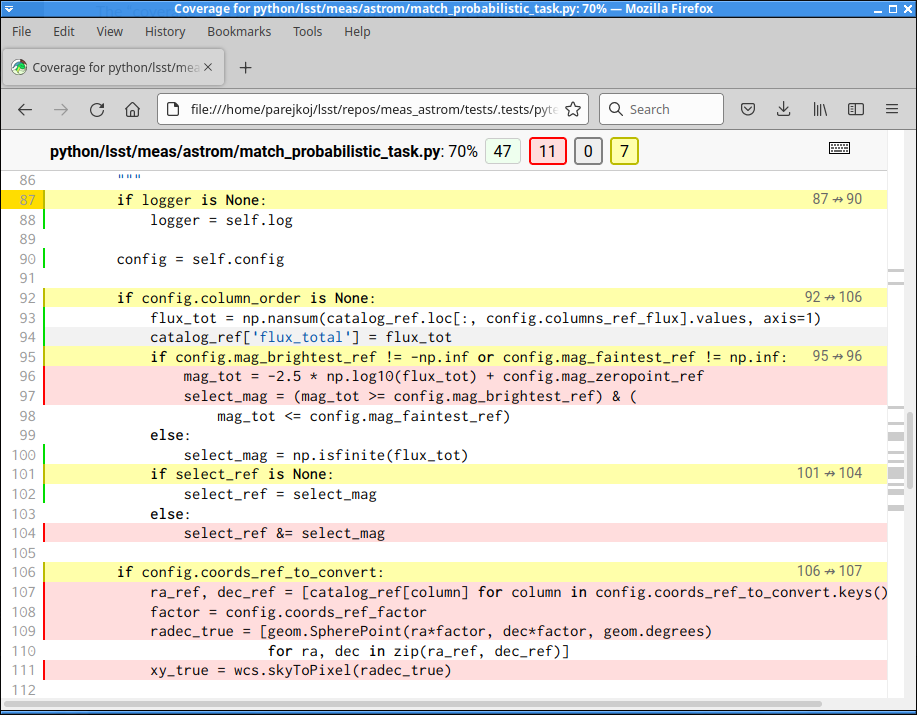
Coverage HTML single file view for match_probabilistic_task.py. Mouse hover over colored lines to see why they are marked. In this case, line 92 is only ever true in the tests (the inside of that if is never skipped), and line 95 is only ever false, resulting in lines 96-98 never being run. Adding tests that set config.mag_brightest_ref/config.mag_faintest_ref and checking that the correct sources are selected would be an improvement.
While viewing the coverage html, use j to go to the next un-executed line, and k to the previous. Click the small keyboard icon on the upper right of the page for other keyboard shortcuts.
Read the Coverage.py docs for more on how to use this tool.
Single test coverage
To get the HTML coverage report for a single test, run pytest with --cov-report html --cov python arguments, and your individual test (see example below).
The --cov python argument tells pytest-cov what directory to output the coverage report for, in this case, everything in python/.
To get the output written to a different directory, put that path after the html, like this example in meas_algorithms:
pytest -sv --cov-report html:htmlcov-gen2 --cov python tests/test_loadReferenceObjects.py
At the end of the test run, pytest will output Coverage HTML written to dir htmlcov-gen2: open the index.html file in that directory to view the report.
Changing the output directory can help compare coverage before and after tests have been modified.
C++
LSST scons builds will automatically instrument all object and link modules with coverage counters when invoked with:
scons profile=gcov
This passes --coverage to all compile and link builds; this is equivalent
to -fprofile-arcs -ftest-coverage on compile and -lgcov on link.
Executing the instrumented program causes coverage output to be accumulated.
For each instrumented object file, the associated files .gcda and
.gcno are created in the object file’s directory. Successive runs add
to the .gcda files resulting in a cumulative picture of object
coverage.
Use one of the following tools to create the coverage analysis reports to verify that your unit testing coverage is adequate. Editor’s preference is for either ggcov or tggcov since only the local source files are processed; see below for details.
gcov
gcov is the original coverage analysis tool delivered with the GNU C/C++ compilers. The coverage analysis output is placed in the current directory. The analysis is done on all source and include files to which the tool is directed so be prepared for reports on all accessed system header files if you use gcov.
Use the following to generate coverage analysis on the LSST
<module>/src directory:
cd <module>
scons profile=gcov
gcov -b -o src/ src/*.cc src.gcov >& src_gcov.log
ggcov
ggcov is an alternate coverage analysis tool to gcov which uses a GTK+ GUI. ggcov uses the same profiling data generated from a GCC instrumented code but uses its own analysis engine.
Use the following to bring up the ggcov GUI:
cd <module>
scons profile=gcov
ggcov -o src/
tggcov
tggcov is the non-graphical interface to ggcov.
tggcov creates its output files in the same directory as the source files are located. It creates analysis files for only the local source files (i.e. not the system files).
Use the following for a comprehensive coverage analysis. Output files will be
in src/*.cc.tggcov:
cd <module>
scons profile=gcov
tggcov -a -B -H -L -N -o src/ src
gcov output files in git directories
gcov coverage output files should be identified as
non-git files to avoid the git warning about untracked
files. In order to permanently ignore all gcov output files, add
the extensions .gcno and .gcda, to the .gitignore
file.
Java
No options have been researched.
Python & C++ Test Setup
DM developers frequently use the Python unittest framework to exercise C++ methods and functions. This scenario still supports the use of the C++ coverage analysis tools.
As usual, the developer instruments the C++ routines for coverage analysis at
compilation time by building with scons profile=gcov. The C++
routines generated from the pybind11 source are also instrumented.
Later when a Python unittester invokes an instrumented C++ routine, the
coverage is recorded into the well-known coverage data files
<src>.gcda and <src>.gcno. Post-processing of the coverage
data files is done by the developer’s choice of C++ coverage analysis tool.
Further reading
Refer to Code Coverage Analysis, by Steve Cornett, for a discussion of coverage metrics and to Minimum Acceptable Code Coverage, also by Steve Cornett, for the companion discussion on determining ‘good-enough’ overall test coverage.